Facebook Economics
Friday, August 31, 2007
Employment and Unemployment in Hungary
For what it is worth, Hungary's rate of unemployment is now running at 7.0% year on year. This is the figure of the May-July period, but it remains unchanged from the previous three-month period, according to the latest report from the Central Statistics Office (PDF).
Now this in itself is strange. Hungarian economic activity is dropping steadily, we may well be going into a recession, yet the unemployment rate hardly seems to be moving. The 7.0% jobless rate (a figure which is even down from the 7.3% March-May rate), is in fact the lowest rate to be achieved since the end of 2004. The following graph shows the evolution of Hungarian unemployment
The KSH state that the number of unemployed in the May - July period was 296,700 and the number of employed 3.949 million. This latter number is a slight drop from the 3.943 m registered in April-June. At the same time the number of unemployed dropped by 5,800 from the previous 3-m period and remained largely unchanged year on year with the same period in 2006. The jobless rate for the 15-24 year old group, which represents 17.8% of all unemployed, was 16.8%, and this was down 1.7 percentage points from the same period last year.
So what is happening here? Well basically Hungary is getting older, and the working age population is starting to fall, that's what seems to be happening. First off here is a graph which shows the actual numbers of unemployed people in Hungary since the start of 2006.
Now lets take a look at the 15 - 64 age group, over the same period. As we can see, in general terms it is dropping steadily.
The employed population in this age group is fluctuating. It seems to have touched bottom in January/February 2007, and to be now increasing again. Given that the economy is slowing considerably while this employment expansion is taking place, one prima facie conclusion would be that productivity is not rising, and may well be slowing, since with more people working and more productivity the economy should accelerate, not slow. Of course one other possibility is that the average number of hours worked per capita is reducing - no overtime etc - and this is a possibility I will try and explore.
When it comes to the age composition of the labour force we can also notice something interesting. Obviously the majority of the workforce are - at this point in time - in the productive age groups between 25 and 55. But it is also interesting to look at participation rates in the groups outside this age bracket, to see what is happening, and what the future has in stor. Below I have made a chart showing the numbers of people in the 65-74, 60-64 and 15-24 age groups. Now what is clear is that these two latter groups are expanding - this is what an ageing workforce means - while the latter, youngest group, is contracting.
This contraction in the 15 to 24 age group can be for a number of reasons. In the first place it is simply a reflection of the fact that there are progressively less and less people in this age group, as can be seen in the next graph.
But even of those who there are in this age group, given that Hungary wants to become a more modern, productive, economy, it is only to be expected that a growing percentage will seek to achieve a higher level of education and training, and this again is reflected in the graph below which show the participation rates for the three groups we are looking at.
So what is apparent is that while the participation rate for the 15 - 24 group has been falling, the rate for the older groups has been rising steadily. This is only to be expected, since raising the participation rates of the the older groups is one of the only ways (outside immigration) that Hungary is going to be able to find extra labour force in the future, plus of course with the fiscal reductions there will be less available in the way of retirement pensions, so it will become normal that people have to work longer.
So is all, in this case well, that ends well. Well not really, since there is productivity to think about here. It is not my intention to be ageist, but a person in the 65-74 group is not productively equivalent to a person in the 40 to 50 group, and this is the swap that countries like Hungary will soon be making.
In conclusion I would like to mention the fact that Hungary might have something to learn from the case of Japan. In order to try and explain what I am getting at, here's a convenient graph of Japanese economic growth 1955 to 2003 prepared by US economist Michael Smitka from Japanese data available here.
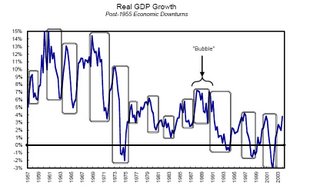
What is obvious from looking at this growth profile is that Japanese growth has been far from uniform over the last 50 years or so. This really shouldn't be so surprising when we think about economic theory a little. Key components of economic growth are the proportions of the total population working, and the kinds of activities they are engaged in. Now if we look at the early part of the graph we can see very high growth rates (which we can also find in eg China, and some parts of Eastern Europe - not Hungary unfortunately - right now). This is know as "catch up" growth, and is due in one part to an ever greater part of the total population becoming involved in economically productive activity, and in the other to a technological (productivity driven) 'catching up' process. As developing countries tend to start at some distance from the existing technological frontier then growth can be proportionately more rapid as they close the distance (again this process can be seen now across the Eastern European EU accession economies).
However - and this is the important point for us here - with time this growth spurt eventually slows, although the loss is to some extent offset as societies generally move up the median age brackets (in the standard cases from median ages of around 30 to median ages in the 35 to 40 category, but this is exactly where Eastern Europe is so very different from the standard case) and by a growing importance of what have come to be known as 'prime age workers' (ie workers in the 35 to 50 age category, just where Hungary is now). A reflection of this prime age wage/productivity effect can be seen in the chart below which shows how the age related earnings structure has altered in Japan over the years between 1970 and 1997.
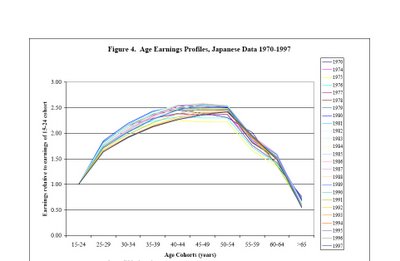
The most important point to note is that wages generally peak somewhere in the 50-54 age range (even though, as a result of the accelerated ageing process which has taken place there many workers in Japan now continue to work up to the age of 75and beyond). The point here is that this individual wage profile may be considered to be some sort of kind of proxy representation for what actually happens to productivity performance of an entire population as it ages. One very revealing detail is that while the shape of the hump has changed somewhat over the years there has been little noticeable drift to the right, which should give some indication of the extent of the age-related productivity problem. Indeed in Japan, as more and more workers have come to belong to the older age groups, aggregate wages at first stagnated, and have now begun to trend down.
OK, this was just an initial exploration. There is no conclusion. Now we need to follow what happens and see how all this works out over time. There are a lot of theories about ageing knocking about all over the place. Now we are going to get to see what the reality actually is.
Thursday, August 30, 2007
Polish GDP Q2 2007
Poland's economy expanded an annual 6.7 percent in the second quarter, faster than expected, suggesting interest rates may be raised a fourth time this year. Growth in gross domestic product compared with 7.4 percent in the first quarter, the Central Statistical Office reported in Warsaw, and exceeded the 6.1 percent median forecast of 21 economists surveyed by Bloomberg. The economy grew 6 percent in the second quarter of 2006.
Bloomberg
In fact the rate of GDP growth in Q2 - which according to my calculations was 0.34% - seems to have slowed from Q1, when it was a fierce 1.6%. This slowdown can be seen in the following chart.
Domestic demand increased year on year by 9.3% in the second quarter, up from 8.6% in the first quarter, and from 5.4 percent in the same period last year. Consumer demand increased 5.1 percent, up from 4.8 percent a year ago, while production grew 6.3 percent, slower than the 9.2 percent growth rate achieved in the second quarter of last year.
The prime contributors to second quarter growth seem to have been fixed investments and a large increase in inventories, which combined boosted annual growth in gross capital formation to 34.2% in the second quarter, up from 26.8% in the first quarter.
Construction, of course, increased considerably - by 17.7 percent - up from 12.1 percent in Q2 2006, but down from the first quarter's 40.1% rate, an output level which had been aided by unusually warm winter weather.Investments rose 22.3 in the second quarter, up from 14.5 percent last year and down from 29.6 percent in the first quarter.
Basically it is very hard to determine anything very clearly at this stage from the provisional data we have. A lot depends on what is happening with the inventories, and where construction is going. As we can see from the following chart, the annual increase in Q2 has slowed somewhat, but this doesn't really mean that the economy is slowing to any significant extent, we need to see more data going forward to decide on this.
What the data does seem to show is that fixed investment has replaced private consumption as the main contributor to growth, and this seems strange. Fixed investment contributed a net 3.8 percentage points to second quarter GDP growth, up from 3.6 percentage points in the first quarter. Private consumption contributed 3.2 percentage points, down from 4.6 in the first quarter.
A negative contribution was made by foreign trade, at -2.6 percentage points, a deeper dent than the -1.1 percentage points registered in the first quarter. Exports increased 7.8% on the year in the second quarter, while imports grew 14.2%. So obviously there are big trade balance issues to think about.
Industrial output growth slowed to 6.3% on the year in the second quarter, from 9.1% in the previous three months. While the services sector expanded 6.0% on the year, down from a 7.4% increase in the first quarter.
Wednesday, August 29, 2007
Katarzyna Zajdel-Kurowska and the Euro
``Poland is definitely on the way to the euro.''
She made this statement after revealing that Poland's 2007 budget deficit will be narrower than the government's original forecast. I have no idea when or whether Poland will enter the euro, but I would say that, as in the case of the Baltics, the potential labour shortage issue, and the problem of wage and cost push inflation that this will generate is a much more important medium term obstacle to Poland's euro membership than the budget deficit issue is.
Polish Central Bank Raises Interest Rates
The Polish economy expanded 7.4 percent in the first quarter, which was the fastest pace in a decade. With wages rising at a record pace in the second quarter, policy makers have said inflation may exceed the central bank's 2.5 percent target by the end of the year unless interest rates are lifted again.
In fact average corporate wages grew at an annual rate of 9.3 percent in July, and at a record rate of 8.9 percent in the second quarter. Employment rose 4.7 percent from a year ago in July, while unemployment fell to 12.2 percent and retail sales rose at an astonishing annual 17.1 percent. The inflation rate fell to 2.3 percent in July from 2.6 percent in June. The central bank expects it to rise to 3.3 percent by December if borrowing costs are left unchanged.
The interesting thing to note here, as can be seen from the piece below from Bloomberg, is that the Zloty kept falling despite the rate increase. The weather is changing, and quickly.
Poland's zloty fell for a second day versus the euro as declines in global equity markets prompted investors to shun riskier emerging-market assets.
The zloty dropped along with Turkey's lira and the Slovak koruna as the NTX Index of stocks in central and eastern Europe's 30 biggest companies lost the most in almost two weeks. The Polish currency was the second-worst performer against the euro in Europe after the Romanian leu.
``Investors are growing increasingly nervous and the declines in equity prices are taking their toll on emerging market currencies,'' said Michal Dybula, central European economist at BNP Paribas SA in Warsaw. ``We may see more losses if U.S. stocks open lower today.''
Against the euro, the zloty fell to a one-week low of 3.8495 and was at 3.8454 by 11:36 a.m. in Warsaw from 3.8302 yesterday. It may extend its drop to 3.9 by the end of 2007, Dybula said.
Monday, August 27, 2007
Hungary Retail Sales June 2007
"In June the fall of retail sales continued. The volume of retail sales adjusted for calendar effects decreased by 1.5% in the first half of 2007, by 3.0% in the second quarter and by 3.6% in June, compared to the same period of the previous year. Compared to the previous month the volume of retail sales adjusted for seasonal and calendar effects fell by 0.4%."
For what they are worth I reproduce the relevant graphs and charts below. If you put together the construction index and the retail sales one, it is clear domestic demand is going to be extremely weak going forward, if you add to this the impact of inflation on exports then this sector will be hard pressed to pull the economy, so it is very hard for me to see where those analysts are getting the growth numbers they have in their forecasts from. More of this in September when we get the detailed breakdown of Q2 2007 GDP.
As we can see from the retail sales index, things are moving down.
If we now look at the monthly change we can see that the last month when sales increased was in fact December, just before xmas.
And the year on year data only adds to the general picture, and to the gloom.
Hungarian Central Bank Keeps Rates on Hold
The rate-setting Monetary Council, which was presided over by bank President Andras Simor, declined to lower the two-week deposit rate from 7.75 percent. The forint has lost 4 percent against the euro over the month before the rate decision - along with several other east European currencies - as investors have been busy selling what are perceived to be risky emerging-market assets.
As Andras Simor is quoted as saying in the press conference, this must have been a very hard decision:``This was a very tough decision.....If Hungary was isolated, there may have been room to cut, but the outside factors motivated the decision.''The bank also raised its forecast for inflation in 2007 to 7.6 percent, compared with the 7.3 percent anticipate three months ago in the last quarterly inflation forecast. It also raised its average 2008 inflation forecast to 4.5 percent from 3.6 percent.
As Gyula Tóth, UniCredit is quoted as saying:
"In terms of why they didn't cut today, we'd say the principal reason is the revision higher in the headline inflation forecast (and the bizarre signal effect of cutting at the same time), with the global market backdrop only a secondary factor."
I couldn't agree more. There was just no way they could lower the rate at this point and maintain credibility on inflation, even though the construction and retail sales data are just crying out for action. But there are more problems, since lowering the rate would be effectively to drop the forint, but then there are all those Swiss Franc denominated mortgages to think about. No easy solutions here, only hard bullets to bite.
Friday, August 24, 2007
Poland, Retail Sales July 2007
Variations in the monthly index can be seen in the chart below.
And the rapid rate of increase can be observed in the next chart which shows annual change each month.
Consumer demand, which is being driven by the fastest growth of wages in six years and a record increase in the number of new jobs, is putting considerable pressure on inflation, and this has already produced a half percentage-point increase in the benchmark interest rate earlier this year. Today's data may lead monetary policy makers to raise the interest rate again as early as at their next meeting on Aug. 28-29.
In a separate report, the office said the rate of unemployment in July dropped to 12.2 percent from 12.4 percent in June. The number of unemployed totaled 1.86 million people, or 39,000 fewer then in June and 587,000 below July last year, when the rate was 15.7 percent. The unemployment data confirmed estimates of the Labor Ministry published on Aug. 8.
The zloty was trading at 3.8389 per euro at 10:05 a.m. in Warsaw, up from 3.847 yesterday. The yield on the government's five-year bonds was unchanged for a second day at 5.69 percent.
Thursday, August 23, 2007
A Welcome 'Slowdown' in Lithuania?
Cross Posted From Alpha Sources
The CEE and Baltic economies are interesting; that much I think is certain. This is especially the case in the light of the recent financial market turmoil which have crippled liquidity conditions. As such, my suggestion as it has been in my previous (main previous entry!) notes on Lithuania and the CEE economies in general is to keep a weary eye on these economies since they might very well end being up at the forefront of any kind of rapid unwind of the current economic climate. Before we dig into the recent economic data I should direct your attention to the fact that my coverage of Lithuania forms a small part of a much wider coverage of the Baltic economies which is conducted alongside Edward Hugh who is running his Baltic Economy Watch
which is a poster blog covering the day-to-day evolution of these economies.
It has been while since the statistical office posted its estimate for Q2 GDP growth which came in slightly lower than the previous quarter. Generally, the GDP performance was narrated as a slowdown but in essence it is a very small one at that. In this way, Lithuania is still fairing at very high growth levels relative to the underlying and deteriorating capacity issues which are spelled out in my previous notes linked above. The graph below extents the GDP series to include Q2 2007 where growth nudged down ever so timidly to 8.0% from 8.3% in Q1.
As far as the other economic data which was treated the last time it is difficult to gauge a significant change. Regarding the CPI and PPI index my last figures already included Q2 and as last time we should be noting the steady upwards tick of CPI. Turning to labour costs and construction input prices only the latter seems to be updated relative to the last time we had Lithuania under the loop. The substantial y-o-y uptick in construction input prices suggest that activity in the construction sector by no means have cooled which indicates that the housing sector has not yet lost steam relative to what seems to be an obvious capacity ceiling. This further suggest, at least somewhat, that the risk of a sudden severe slump cannot yet be ruled out.
Another major thread in my analysis of Lithuania has been a rigorous analysis of the labour market as a proxy for assessing just what the underlying capacity issues were. Before we try to extent the analysis from where we broke off last time it serves to remember the inbuilt difficulties with securing adequacy in terms of analysing the human capital situation in Lithuania. The first issue relates to something which I have already briefly touched upon as it pits the data from the official Lithuanian Statistical Department against data from the Vilnius based Labour Exchange Office. The inbuilt downward bias in the data from the Labour Exchange Office suggest that capacity in Lithuania as measured by the unemployment rate and absolute number of unemployed persons is substantially lower than what is cited by Eurostat and the official statistical department. I cannot by no means give any indication as to which number to actually rely on but merely note that it is very difficult to provide a fixed point from which to make general analysis. However, what is very clear is that capacity in Lithuania is indeed declining and from already very low levels. The second point relates to general uncertainties regarding the population census which is well summarised in this small pointer from the Baltic Times.
Lithuania's state institutions do not know how many residents there are in the country, it has been revealed, with different bodies giving significantly differing estimates of the population. There are two offices subordinate to the Interior Ministry of Lithuania - the Migration Department and the Residents' Register Service. The names of the departments may give the impression that they keep track of population levels and how many passports have been issued, but this is not in fact the case, reports the Lietuvos Zinios newspaper. The Head of the Passport Division of the Migration Department,Danute Matareviciene,told the paper that she had no statistics on how many passports have been issued. The Residents' Register Service drew a balnk when asked as well.
The closest thing to an official figure can be found at the Department of Statistics. During the second quarter of 2007, 3,338,000 residents were registered in Lithuania, but only 3,162,879 have citizenship. Further confusion is created by data on official and unofficial emigration levels. Officially the number who left the country between 2003-2006 was 54,400. Unofficially the department puts the figure at 76,700, though other institutions suggest the number is actually as high as 500,000. Given the large number of Lithuanians working in other parts of Europe, and particularly the UK and Eire, this last figure seems far more realistic.
Apart from the obvious feedback mechanism with general labour market analysis this uncertainty also strongly affects my previous notes on net migration. Clearly, there can be no doubt that the trend is negative but when we think about this number of 500.000 cited as an unofficial estimate of net outward migration between 2003-2006 we also need to remember the inbuilt uncertainty relating to citizenship. More generally relating to the graphs I fielded in my previous main note the data is still more or less up to date. According to Eurostat the total amount of persons unemployed basically held steady in July at 75.400 compared to June's 75.300. This also translates into an unchanged unemployment rate at 4.7% in July 2007.
Lastly, and in connection with Edward's recent note on how Fitch downgraded Latvia foreign currency issuer default rating (IDR) to ‘BBB+’ from ‘A- as well as also downgrading the currency IDR to ‘BBB+‘ from A-. In this respect, Lithuania is still set on A and A+ respectively which reflects the fact that Latvia is showing stronger signs of overheating than its neighbour to the South. However, the recent move by Fitch on Latvia might be the first tentative sign that the current market turmoils will be followed by a more wide re-appraisal of risk. Especially in this light I will be looking closely at Lithuania and indicators such as labour costs, core inflation, and capital inflows since these indicators will be certain to raise the red lights quicker than they would have just a few weeks ago. Also, and since the genie now is pretty much out of the bottle in terms of coupling the current situation with the rumblings of 1998 the recent credit and capital inflows into the CEE economies should cause more than a few raised eyebrows.
As a final note I want to sketch out a bit where I am going from here on in my coverage of Lithuania and more generally the global economy. As such, I am thinking and collecting noted regarding a longer note on the rating agencies and their role in this whole debacle. On Lithuania, I will also try to look more closely at previously neglected areas in my analysis such as a detailed look at the balance of payment situation (i.e. source of funding) as well as the FDI stock which by no means is trivial. All this of course should be closely tied to the pegged currency and the strains this situation is set to be put in if the economy stays in its current high growth trajectory.
So in short, stay tuned.Polish Migrants More Choosy About Their Jobs in the UK
According to the UK Home Office, the number of workers applying to work in the UK from the A8 countries – the eight eastern and central European nations of the As analysed by Latvian Abroad here, almost two-thirds of the 683,000 workers who have applied to work in the UK from A8 countries have come from Poland.
The latest UK figures appear to show that eastern and central European migrants had started to move up the jobs chain and are occupying more professional positions.
Some 41 per cent of registered workers applied to work in administration, business or management posts during the latest quarter. This compared with 25 per cent three years ago when Britain opened its job market to A8 workers.
On the other hand, UK fruit and vegetable growers have warned this week that they are facing a struggle to attract sufficient eastern and central Europeans to harvest their crops because A8 workers had become more choosy about the work they undertook.
According to the Home Office the hospitality industry has accounted for 19 per cent of jobs filled by A8 workers, and agriculture 11 per cent, since 2004.
Wednesday, August 22, 2007
Running out of Capacity in Central and Eastern Europe
Cross Posted From Alpha Sources
Well, it is pretty much official now I think that some countries in Eastern Europe might be heading for an economic crash. As such, both the FT and the Economist recently ran articles on this topic in which warnings were duly handed out. On the record, I am pretty convinced myself that some countries might crash very soon among those the most notable candidates being Latvia and Lithuania. Behind this doom and gloom call is a very simple hypothesis that demographics matter for economic growth and that this fact is now hitting home big time in the CEE countries proxied by dwindling capacity to match expectations of economic growth and prosperity. Of course I am sad to say, the mainstream coverage cited above did not have the faintest squeak about demographics and the unique population regime in which the CEE countries are situated. For that reason I recommend you to read Edward Hugh's recent post at AFOE in which he pins the Economist, his note on Latvia as well as my own analysis on Lithuania. In this entry I am looking at Poland in much the same way that I have been looking recently at Lithuania. Clearly, Poland are Lithuania are different not only because of the differences in size but also because Poland seems to be equipped with much more spare capacity than is presently the case in Lithuania and the other Baltic countries for that matter. I have marked 'seems' in italic since whereas Poland's unemployment rate is still in double digit territory accounts of substantial labour shortages are mounting which suggests that high growth regions in Poland are fast running out of qualified labour. In this way, the trend in the labour force is very similar to Lithuania but where Lithuania represents a small single deck frigate which is set to quickly succumb to any water intake Poland perhaps resembles more the Titanic. However, as I will demonstrate below, through graphs, the tendency is the same which only further substantiates the claim that when it comes to the CEE economies it is in fact, at this point, all about demographics and even though I realize that I am biased in my view here from the offset I just cannot see how any reasonable economist would be able to argue otherwise.
Let us look at the data then and more specifically the short term indicators on economic growth which show how growth and wage costs have been picking up the pace lately which also shows itself in a widening current account deficit. The first graph plots (in % y-o-y) growth in GDP, wage costs and industrial production, the second plots retail sales and the third plots the evolution of the current account deficit. Note that while the graphs for GDP(etc) and the current account share time perspective in the form of quarterly indicators the graph for retail sales plots monthly y-o-y % growth rates.
As can readily be seen, growth in Poland had been indeed picking up the pace in the past year. This has naturally pushed up the demand for labour with an ensuing rather dramatic tightening of the labour market to follow. Also wage costs are beginning to rise rapidly and as the Economist Intelligence Unit reports (sorry, no link available) labour productivity is not able to follow the speeds of wage increases which of course questions the sustainability of this brisk growth spurt. This is accentuated in the following quote which cites the view of JPMorgan ...
In Poland, JPMorgan expects the dataflow over the next two weeks to confirm that “the labour market continues to tighten fast and that the labor productivity-wage relationship is deteriorating."
Curiously, wage costs are yet to show up in core inflation and producer price inflation where growth is still very moderate relative to the overall economic growth rate. It serves to remember here that the Polish unemployment rate is still in double digit territory which indicates that capacity needs to be a bit more strained for pressures in CPI and PPI indices to take hold.
This brings us to the general labour market dynamics which are presented below in terms of short-term indicators which share the time perspective as the economic data above. Essentially, two identical time series for unemployment are presented with the first being in real numbers and the second in percentage of the workforce.
Clearly, the situation in Poland is very different from Lithuania and as such unemployment in Poland still linger in double digit territory. However, this will not go on for much longer if the current growth rates are sustained and this is where the problems begin to emerge. As such, you could choose to flag optimism in Poland on the basis of what is after all very impressive economic momentum which at this point is even welcomely deviating from nudging up core inflation rates. However, this is also at the core of the problem with almost all CEE countries in the midst of what is currently an unprecedented spurt of global growth. These economies are thus growing briskly, quite naturally, as emerging economies but with the important qualifier that they have extremely mature and essentially loop sided demographic profiles. This means that given the underlying capacity constraints these economies are faced with they are quite simply growing much faster than is sustainable in any meaningful sense of the word. This has then, at this point, obviously caught up with market participants and financial commentators but my guess is that it is moving way faster than many seem to think. Clearly, Poland is not Lithuania where the time span is already under one year but it still raises the question of just how much further this can go given the underlying structural capacity issues. Also remember here that while structural remedies such as raising labour force participation rates as well to address the skill mismatch on the domestic labour market should be strongly advised this is just moving so fast in some countries that this really does not seem to be a viable solution to address what is clearly becoming a short term issue with long term and structural drivers. In the end, what we have now regarding the CEE economies is evidence that a demographic profile wholly out of sync with the economic stage of development effectively can halt the process of catch-up growth. In order to ram this point home here at the end we need to look at productivity and how brisk productivity needs to grow in order follow suit. And this is just the point; catch-up growth and productivity increase as an economy moves up the value chain takes time and time is exactly what the CEE countries do not have at this point with the current growth rates.
Appendix
This was really the end of this entry but if you want to catch a glimpse of how fast this might be moving I invite you to read on. However, beware ... dodgy empirical methods and math will follow! Let us try then to do a thought experiment and ask the question, how far will it take for the Polish economy to reach a 'critical' level of unemployment rate where 'critical' here is defined as either a 3% or 5% unemployment rate?
Well, before we move I need to attach some important qualifiers.
Firstly, the following thought experiment does very little to represent sound empirical economics but the general approach is still worth while I think. As such, we know that rapidly ageing societies, especially those growing rapidly as is the case here, will tend to face a structural decline in the unemployment rate and/or the labour force as more people leave the labour force compared to entrants. Add to this, in the Polish case, the trend of net outward migration as well as the high economic growth rates and suddenly an unemployment rate of 10% becomes a rather small buffer. Secondly, be aware since math will now follow. I rarely do this at Alpha.Sources and I promise you that it will not turn into a habit but I think that it is important in this case.
Regarding the method I have already hedged my bets above and please do note that the underlying assumption of trend perpetuity in the following experiment makes the predictive power virtually useless, at least at the time horizon we will be looking at. So, what are we in fact looking at?
Well, based on rough and ready calculations the average monthly decline in the unemployment rate in Poland between July-06 and May-07 stood at a monthly decline of 2.4% (i.e. in absolute terms). Based on an all things equal approach, assuming trend perpetuity, how far would it take for Poland to reach an unemployment rate of 3% and 5% respectively? To answer this we use the common expression for time value of money as an imperfect yet useful approximation:
FV = PV(1+r)n (in our case -n but that is of little matter)
where FV denotes future value at time n, PV the present value at time 0, r is the compound rate at each period, and finally n denotes the periods. In our little experiment we approximate the expression to our need by assigning the values as follows;
FV: 3% and 5%
PV 10,5% (unemployment in May 07)
r: 2.4% (average monthly decline)
n: ? (i.e. this is what we want to find out)
Calculating for 3% ...
3 = 10,5(1.024)n
solving for n ... (a bit complicated but Excel delivers in a heartbeat)
In(3/10,5)/In(1.024) = -52.8
Which translates into about 53 months to reach an unemployment rate of 3% or 53/12 = 4.4 years assuming trend perpetuity.
Calculating for 5% ...
5 = 10,5(1.024)n
solving for n ...
In(5/10,5)/In(1.024) = -31.2
Which translates into about 31 months to reach an unemployment rate of 5% or 31/12 = 2.6 years assuming trend perpetuity.
So, was this useful at all? Well, perhaps not but do note that the assumption of 'perpetuity' as regards to a structural decline in the labour force/unemployment rate is not entirely voodoo magic when we think about the CEE societies. Clearly however, the process will be subject to notable nonlinearities as we approach ever lower levels and furthermore it is not certain that the current cyclical economic boost will continue. But the point is that, at the pace with which this is moving it is difficult to see how structural mechanisms such as improving labour market institutions, raising participation rates, and addressing the skill mismatch can keep up with the structural and cyclical run on the level of capacity if it continues much longer. Especially, the fact that these countries are now targets for a substantial part of new global credit suggests that the pressure is very high indeed. Note also that many central banks in the region would be effectively unable to act as a lot credit is denominated in foreign currency. As such, an aggressive turn of monetary policy to the loose side would entail severe balance sheet issues as the countries' domestic currencies most likely would plummet. Effectively this would mean strong appreciation of the liability side (denominated in e.g. Euro) relative to the asset side (denominated in the domestic currency).
In the end, whatever rate of decline we assign in our little pet model here we are looking at a horizon in most CEE countries where labour markets are set to tighten significantly in the next 2 years and in some countries it will move much faster than this.Tuesday, August 21, 2007
The Economist Intelligence Unit On Hungary
There are three major risks for Hungary’s real economy arising from the currency and stockmarket troubles. First, the weakening currency threatens the achievement of the authorities’ inflation target and so could the central bank to halt its monetary easing. The National Bank of Hungary (NBH) says that its inflation target is achievable at an exchange rate of Ft250-255:€1; it follows that if the exchange rate stays around Ft260:€1 or worse, then imported inflation will threaten the target.
In other regional economies, which are growing strongly, a mild monetary tightening would not be unduly worrying. Hungary, however, is in the midst of an austerity drive that has nearly brought the economy to a standstill. In a region where first-quarter GDP growth averaged around 7%, Hungary’s economy grew by just 2.7%. The flash estimate for the second quarter, at just 1.4% year on year, is even more alarming. In this context, the maintenance of relatively high interest rates at their current level is the last thing the economy needs. Still, this remains a serious risk.
Second, the government’s budgetary management--and its painstaking efforts to rebuild credibility--appear vulnerable. Prime Minister Ferenc Gyurcsany’s administration has cut its deficit target for 2007 twice already this year, in moves welcomed by markets, and has generally adopted a conservative approach to forecasting. However, July’s budgetary number exceeded the target. The comfort zone that the government has created, as part of its effort to rebuild its reputation, has shrunk dramatically.
Because public-sector debt is at 66% of GDP, a serious liquidity crunch that increases the cost of borrowing could quite easily push the government’s budgetary management off-course, thereby undercutting Mr Gyurcsany’s efforts to rebuild credibility among investors.
Third, the banking sector is potentially vulnerable and so too are Hungary’s legions of borrowers in foreign currency. The West European banks that dominate Hungary’s financial sector hail mainly from Austria, Germany and the Netherlands, all countries with some bank-sector exposure to the US subprime market. This raises a question as to whether borrowing costs in Hungary could rise if such banks experience liquidity problems and so are forced to tighten lending policies.
Moreover, despite the austerity measures enacted in recent months, Hungarian households are continuing to borrow—predominantly in Swiss francs rather than their own currency—as they seek to cushion the impact of falling real wages. Foreign-currency loans have been a feature of Hungary’s financial scene for several years. It wasn’t a problem when the forint faced mainly appreciating pressure. Now the Swiss currency is appreciating against the euro, and the forint has slumped. If this situation is maintained beyond a few weeks, Hungarian borrowers will struggle to meet their monthly payments. This will cast another shadow on an already glooming macroeconomic picture and could conceivably push several banks into serious trouble.
Sunday, August 19, 2007
Construction Activity in Hungary
But what can also be observed is the steepness of the decline in June, which can also be noted in the chart for monthly changes (see below). As a result of the June drop - which according to the statistical office occurred in both large construction companies involved in areas like road construction and small firms involved in residential construction activity - the 12-month index fell 15% to reach its lowest since 2003. Although the construction industry constitutes a comparatively small share of the overall Hungarian GDP (in the region of 5%), these poor results may partly help to explain Hungary's poor Q2 GDP growth figure, although we will have to await the detailed breakdown of Q2 GDP due in September to confirm this.
The construction of buildings fell by 15.2% and that of civil engineering decreased by 16.6% when compared with June 2006. Since the start of 2007 construction of buildings has fallen by 1.3% while civil engineering is down by 6.8% as compared with the first six months of 2006. Month on month (ie when compared with May 2007) the construction of buildings decreased by 7.4%, while activity in civil engineering fell by 5.2%.
The stock of orders at the end of June was 41.3% below the level for June 2006. Within this, the stock of orders for building construction decreased by 23% while that for civil engineering was down by a half.
All of this is consistent with a sharp reduction in government spending (civil engineering) and in domestic consumption (housebuilding), as such it really should have been expected, although as I say, given the small share of construction in GDP this reduction alone cannot explain the low Q2 reading.
The extent of the slump in construction activity is also very clear from the following chart which shows annual changes in output by month. The extent of the drop in June is very clear, as is striking the fact that positive y-o-y readings have only been registered in 3 months since the start of 2006.
What is really puzzling me is what can be seen from the chart below, which shows trend construction from the start of 2004. As can be seen there was something of a boom in 2005 which then petered out, since which time it has been downhill all the way. What I don't really understand is why construction should have slowed after mid 2005, while across the rest of the EU8 and in the rest of Europe generally activity was accelerating. This just seems to be one more area where the evolution of the Hungarian economy seems to be somewhat out of step with the rest. I only wish I understood why. Comments welcome.
Saturday, August 18, 2007
Hungary Second Quarter 2007 GDP
This was the lowest quarterly rate to be recorded in Hungary since 1996 (as can be seen to some extent from the chart below which unfortunately only goes back to the start of 2005) and well below the general expectations of analysts, who had mainly been predicting GDP growth of over 2% for 2007. This number would now seem highly optimistic.
Hungary is in fact in the middle of a really tough fiscal readjustment as the government attempts to reduce its budget deficit, which at 9.2% in 2006 was by far the largest in the European Union. The main impact of the austerity programme has been on internal demand and thus Hungary’s GDP growth - which had been hovering around the 4% mark in recent years (see chart below) - has inevitably taken a hit.
Lars Rasmussen, analyst at Danske Bank, says in a research note that:
Preliminary GDP numbers for Q2 published this morning, showed that growth continues to slow quite dramatically. More specifically, economic growth plunged to 1.4% y/y in Q2 well below our projection (2.4% y/y) and the market expectation (2.5% y/y) and down from 2.7% y/y in Q1. Growth is the lowest in 11 years, and the slowdown in inflation continues pretty much as expected. The numbers are confirmation that last year's fiscal tightening is working. This is obviously positive and we would expect inflation to continue to ease in the coming months, which could keep the door open for a fur-ther moderate easing of monetary policy. That said, the worsened global credit conditions could weigh on the Hungarian forint going forward and make monetary easing harder, and the Hungarian central bank is likely to move very cautiously on monetary easing.
We will have cause to return to this issue in subsequent posts, but it is clear that the current global market volatility - and the accompanying pressure on the Forint - will only serve to make it very difficult for the National Bank of Hungary to lower interest rates, and thus put some sort of platform under domestic demand. All of which, being blunt, means that the Hungarian authorities now face a very difficult situation indeed.
This is especially true given that some 80% of Hungarian mortgages are in Swiss Francs (and a more substantial analysis here), which means that any significant drop in the Forint would really cause substantial problems for domestic consumption way beyond those which are already arising. On the other hand, of course, given Hungary's currently high inflation rate (in the 8 to 9% range) it will be really hard to achieve export competitiveness without some sort of devaluation of the Forint (which is, of course, already happening as part of the global credit correction). So the Hungarian authorities are stuck between the proverbial rock and the hard place.
If we look at the chart below we will see that the actual GDP growth in Q2 2007 which was only 0.2% was very low indeed. With domestic demand dropping rapidly, and the external environment possibly about to take a turn for the worse things do not really look any too good.
However, if it is any cheer for any of my Hungarian readers, Lars Rasmussen's Danske Bank colleague Lars Christensen is widely quoted as saying that Hungary should not be too worried by apparently falling behind the region. “The slowdown will make more room for growth,” he said. “A lot of countries in Central and Eastern Europe - Bulgaria, Romania and Slovakia - have not taken the measures Hungary have and will be in a worse situation in a few years.” Well, leaving aside the issue of whether we should really be taking delight in others difficulties, I'm afraid that while Christiansen may well be right that it may well not be long before "the Baltic disease" (strong inflow of funds coupled with strong outflow of people, after many years of very low fertility, producing massive overheating and dramatic wage inflation) strikes the mentioned countries, it should be noted that this has NOT been Hungary's problem, although Hungary does - like all the other Eastern European countries - have a very limited demographic time window across which to address the underlying problem, so unfortunately it may well not be true that the ground lost during the current impending slowdown can be so easily recovered later. More on this as we move forward.
Tuesday, August 14, 2007
Polish Fertility
The declining birth rate observed for years has prompted the government to come up with a long-term pro-family program, which is expected to encourage women to have more kids. Poland’s fertility rate - that is the number of children per one woman – is the lowest in Europe. In 2005 it was 1.24, whereas the EU average is 1.5, according to a report just published by the statistical office of the European Union – Eurostat.
Actually, it isn't clear that Poland still has the lowest fertility in the EU, since according to the 2006 CIA factbook, by 2006 Polish fertility had sneaked back up to 1.26 Tfr, whilst the Czech Republic was down at the 1.24 level. However - as can be seen from the graph below - whichever way you look at it, Poland has a serious fertility problem, and one which is set to only make those labour shortages currently being experienced worse with time.
Poland's population has been in natural decline since the early years of this century:
“Since 1984 the number of children born in Poland has been decreasing. In 1999, for the first time, the number of deaths exceeded the number of births. We have a truly difficult demographic situation”. A number of factors are at play causing women to postpone childbirth and to have less children. Aneta Seibert from the Gender Equality Coalition explains.
As suggested in the article, one for the reasons for the strength of the decline in Poland has been - as elsewhere - birth postponement:
Since the median age at first birth of Polish women is still in the mid twenties, and thus some way below the current Western European norm of 29-30, it would appear that this postponement process still has some way to run.
But in addition to the general postponement process, there are number of other factors at work, which stem from the traditional nature of Polish society:
“One is very evident discrimination of women on the labor market associated with the fact that that they are mothers or that they may become mothers. There is a very wrong assumption among Polish employers that once you become a mother somehow your qualifications disappear along with your commitment to work.”
and
Another important factor is lack of institutionalized good quality and affordable child care, especially for children under 3. “In Poland only 2 percent of children under 3 attend organized child care while in other countries it’s over 50 percent, similarly with kindergartens.”
Now the response to all of this has been an attempt by the Polish government to give more support to would be parents, the problem is that this costs money, and money is what the Polish government is not exactly flush with given the need to control the deficit and reduce the tax wedge (as mentioned in the last post). So there seems to be a kind of self-reinforcing double-bind at work here.
The government is preparing a comprehensive program of support for the family. Some 5.9 billion US dollars may be spent until 2014 on pro-family measures such as extended maternity benefits, tax breaks for families with several children.
As some of the skeptics claim, all of this may be far short of what is needed, but the question still remains, where is the money going to come from?
The BBC also had an article on the new initiative as well as this more general article on the decline of childbirth in Poland. Essentially the BBC also highlight the missmatch between a rapidly evolving society - and in particular a changing labour market - and the presence of traditional values:
If you asked many people which countries are the most Catholic and traditional in Europe, they would probably answer either Ireland or Poland. And in many respects they would be right. Anna Jurczak, who has six-month-old twin boys. Women's expectations of men are changing, says Anna Jurczak According to surveys, around two-thirds of Poles go to church every Sunday and 70% say that family and children are the most important things in their lives....
So why are family-oriented Poles having fewer babies? It is partly because there is a difference between what people say and what they do. And it is also because Polish society has been undergoing profound changes in recent decades.
First, more and more young people, especially women, are going to college and university.
"Women are becoming more and more demanding. They want to get a job and career first so they're not dependent on their husband later," says 34-year-old Anna Jurczak, who has six-month-old twin boys. "Twenty years ago you had to get married young but in our generation, my friends and I, first of all we want to find a good job and then we can find someone we can love." And women are getting more choosy when it comes to picking a suitable husband, she says.
Another dramatic change came with the transition from communism to a market-based economy. Under communism unemployment officially didn't exist. Now, at 18%, it's the highest in the European Union.
As well as concerns about job security, there is a chronic housing shortage and many young people live with their parents because they cannot afford a flat. The cost of raising a family is also increasing.Another reason why women are reluctant to break their career to start a family is because they fear they won't be able to get their jobs back after taking maternity leave.
Finally, I think one think needs to be borne clearly in mind here. Any success in nudging fertility back up again using the kinds of measures which are presently discussed will only have any kind of impact on the labour market in over 20 years time, and in the meantime the brunt of the labour shortages problem I spoke about in the last post is really going to lock in between now and 2020.
Which isn't to say that you don't need to address the low-fertility issue, but simply that this alone isn't going to be enough.
Wednesday, August 1, 2007
Ageing and Eastern Europe
"The region's rapidly changing demography is a dramatic trend with potentially major economic and social implications" and is "proceeding at a pace not seen before for such a diverse group of countries"
The full report - From Red to Gray: The “Third Transition” of Aging Populations in Eastern Europe and the Former Soviet Union - can be found here.
******************************************
Aging poses economic threat to East Europe
Rapidly aging populations will threaten economic success in Eastern Europe and the former Soviet Union if governments fall behind on welfare-state reforms and fail to promote high-value jobs, the World Bank said Wednesday.
People in the region will become among the world's oldest by 2025, and a mix of low birth rates, longer lifespan and fragile post-communist economies will likely force higher spending on health care, pensions and care for the elderly, the development bank said. The region's rapidly changing demography „is a dramatic trend with potentially major economic and social implications,” and is „proceeding at a pace not seen before for such a diverse group of countries,” a World Bank report said.
As East Europeans and Russians turn grayer, only Turkey and four small, ex-Soviet Central Asian republics will have the population growth to stay 'young countries' by 2025, with fewer than 10% of residents under age 65, the report said. Overall, the region was projected to lose 24 million people, with Russia shrinking by 17 million over the next two decades. The survey highlights how the post-communist nations of Eastern Europe, famously contrasted to the 'old Europe' of France and Germany by former US defense secretary Donald Rumsfeld, are getting old themselves. Japan and Western Europe have been getting older for decades, leading to the familiar crunch of a shrinking pool of workers to pay the taxes that finance welfare-state benefits for an aging population. But the pace of aging in Eastern Europe and the former Soviet Union is faster, and the continuing post-communist transition „makes the region's experience unique and especially challenging,” the report said.
By 2025, 20-25% of the people in nine countries - from Azerbaijan to Slovakia - will be 65 and older, according to the World Bank report, which used UN population data for its forecasts. Slovenia will have the oldest population among the 28 nations surveyed, followed by Croatia, Czech Republic, Bulgaria and Hungary, the report said. Slovenia, which adopted the euro this year in a mark of economic progress, will see its over-65 age group grow from 14% in 2000 to about 23% in 2025, falling between projections for Britain (20%) and Italy (26%), the report said. It expressed particular concern about the looming „expenditure shock” of long-term health care for the rising number of old people. „The key is to design delivery arrangements that are substantially less expensive than hospital services,” a summary of the report said. „To achieve this, it is necessary to recognize and support informal caregivers.”
Governments should also combat the labor-force crunch by raising the retirement age, encouraging flexible forms of employment and expanding financial markets to promote investment in high-productivity jobs, the World Bank said. In contrast, most demographers believe that child benefits and tax breaks that many Western European governments offer to couples with children have a 'negligible' effect on promoting births, the report said.
Worst placed to tackle the challenges are aging former Soviet nations and many countries in the western Balkans where post-communist reforms have lagged, the report said. In contrast, 10 East European nations that have joined the European Union since 2004, as well as Albania and Croatia, are well-placed if economic reforms continue at the present pace, the World Bank said. Whatever the policy mix, countries have a chance to avoid a low-growth future, the World Bank analysts said. „The danger lies in complacency,” they said.